Augusta, Georgia Area: Beds, Inpatient Days, and Average Length of Stay
For the first post in this series, I want to cover Worksheet S-3, Part I on the Medicare Cost Report. This worksheet covers beds, bed days available, Medicare days, Medicaid days, total days, Medicare discharges, Medicaid discharges, and total discharges. There’s some other information like FTEs and observation days on this worksheet as well, but those won’t be covered in this post.
The questions I want to answer (for myself) are as follows:
- What is the size of these hospitals?
- What’s the volume like? Are they full or empty?
- What the makeup of the patient population? Are they mostly Medicare or Medicaid?
- How long do the patients end up staying in the hospital?
Let’s begin.
Beds
In order to get an idea of the size of the hospitals, I looked to see what the number of beds in service reported on the last available cost report. This number may be different than the number of beds listed on a hospital’s website. Hospitals usually list their licensed beds, which is the number of beds that are physically available. Beds in service are the ones that are staffed.
Here’s what beds in service means as defined by CMS:
A bed means an adult bed, pediatric bed, birthing room, or newborn ICU bed (excluding newborn bassinets) maintained in a patient care area for lodging patients in acute, long term, or domiciliary areas of the hospital. Beds in labor room, birthing room, postanesthesia, postoperative recovery rooms, outpatient areas, emergency rooms, ancillary departments, nurses’ and other staff residences, and other such areas which are regularly maintained and utilized for only a portion of the stay of patients (primarily for special procedures or not for inpatient lodging) are not termed a bed for these purposes.
Using that definition, these are the number of beds reported.
| Hospital | Beds |
|---|---|
| University Health Services | 560 |
| AU Medical Center | 486 |
| Doctors Hospital of Augusta | 259 |
| Aiken Regional Medical Center | 200 |
| Washington County Regional Medical Center | 56 |
| Emanuel Medical Center | 45 |
| Burke Medical Center | 40 |
| Jefferson Hospital | 37 |
| McDuffie Regional Medical Center | 25 |
There are four large hospitals in the Augusta area: University Health Services, AU Medical Center, Doctors Hospitals of Augusta, and Aiken Regional Medical Center. The remaining are hospitals in rural counties surrounding Augusta.
Five hundred beds is a large hospital. Having two in Augusta and two more around 200-300 beds is really surprising. I guess I never realized how large of a medical community Augusta had.
Bed Utilization
We can see that University Hospital has the most beds, but are they utilizing all of those beds? How often are the beds in service? This information can be calculated using the number of inpatient days divided by bed days available (beds * number of days in cost report period).
| Hospital | Inpatient Days | Nursery Days | Bed Utilization |
|---|---|---|---|
| University Health Services | 128,371 | 6,232 | 62% |
| AU Medical Center | 120,457 | 0 | 68% |
| Doctors Hospital of Augusta | 71,418 | 4,501 | 71% |
| Aiken Regional Medical Center | 47,560 | 1,990 | 63% |
| Washington County Regional Medical Center | 2,883 | 0 | 14% |
| Emanuel Medical Center | 4,199 | 0 | 26% |
| Burke Medical Center | 1,032 | 0 | 7% |
| Jefferson Hospital | 1,598 | 0 | 12% |
| McDuffie Regional Medical Center | 4,784 | 0 | 52% |
Given this data, what can we infer? First, the large hospitals in Augusta are busy running at about 60-65% capacity. It’s difficult to do a thorough comparison of utilization because there’s no nursery days reported on AU Medical Center’s nursery line. They would most likely have some and are likely included with adults & peds or maybe NICU. Nursery days are needed because they are backed out of the calculation since the beds are not included in the bed count. Because of this, we can’t truly compare bed utilization between the hospitals, but it does look about even among the large hospitals.
Regarding the small hospitals, many of them would have swing beds. Swing beds are used to provide post-hospital skilled nursing care to patients. Skilled nursing is a lower level of care than acute and reported separately. Therefore, just because the hospital shows low bed utilization, it does not mean the beds are not in use.
The large hospitals seem to be utilizing their beds efficiently. Given more information, you may find certain departments are at capacity while others are struggling. I’m very pleased to see though that overall, the large hospitals are busy with lots of inpatients.
It is harder to judge the bed utilization at the small hospitals since I did not look at whether or not they have swing beds.
Medicare and Medicaid Day Utilization
What percentage of the total inpatient days are Medicare or Medicaid? One thing to note is a patient can have both Medicare and Medicaid insurances. These patients will be reported with Medicare as that would be their primary insurance. However, if a patient has a commercial insurance and Medicaid as their secondary insurance, they are included in the Medicaid days figure. It’s a little confusing. The point is, the Medicare patients can have Medicaid and if they do, the days are not included in the Medicaid days figure.
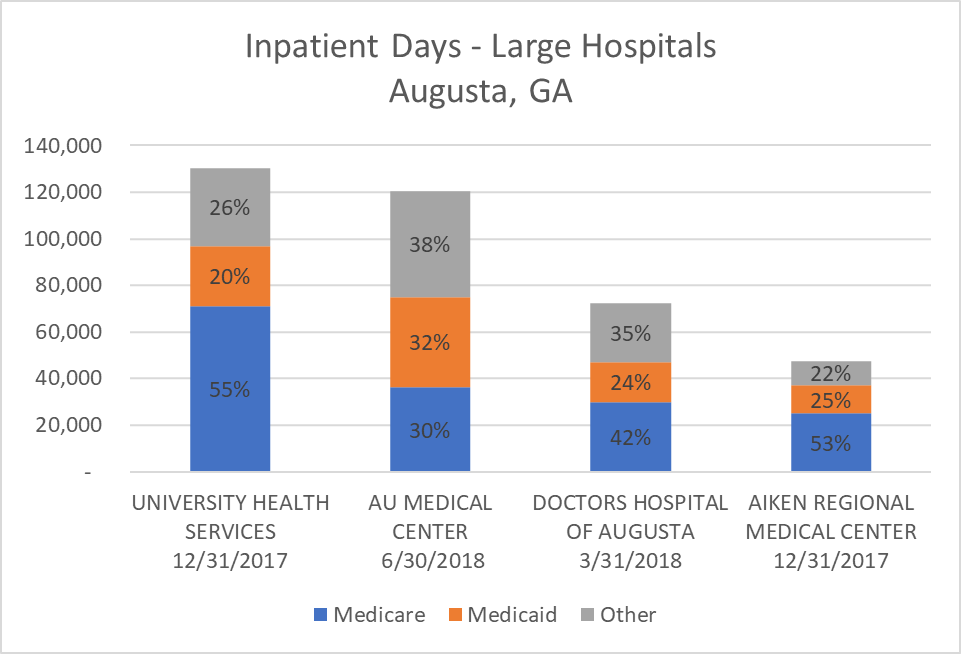
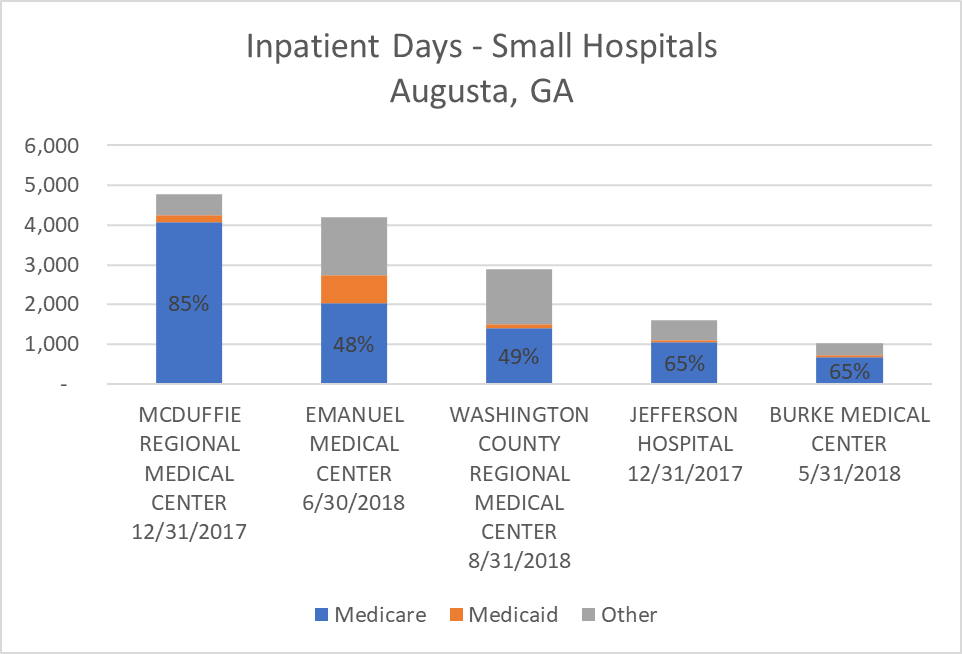
The first thing that jumps out at me is how much Medicare volume these hospitals have. Wow! Over half of the inpatients at University Hospital have Medicare. Across the board though, the majority of the patients have governmental insurances. The high percentages of Medicare at the rural hospitals makes me wonder if the census data will show older populations living in these areas. That’s another area to research.
Overall, I am actually surprised there is not more Medicaid at all of these hospitals. That may just come from my perception of some of these communities as being lower income populations. This is a good reason to do data dives like this: correct incorrect assumptions.
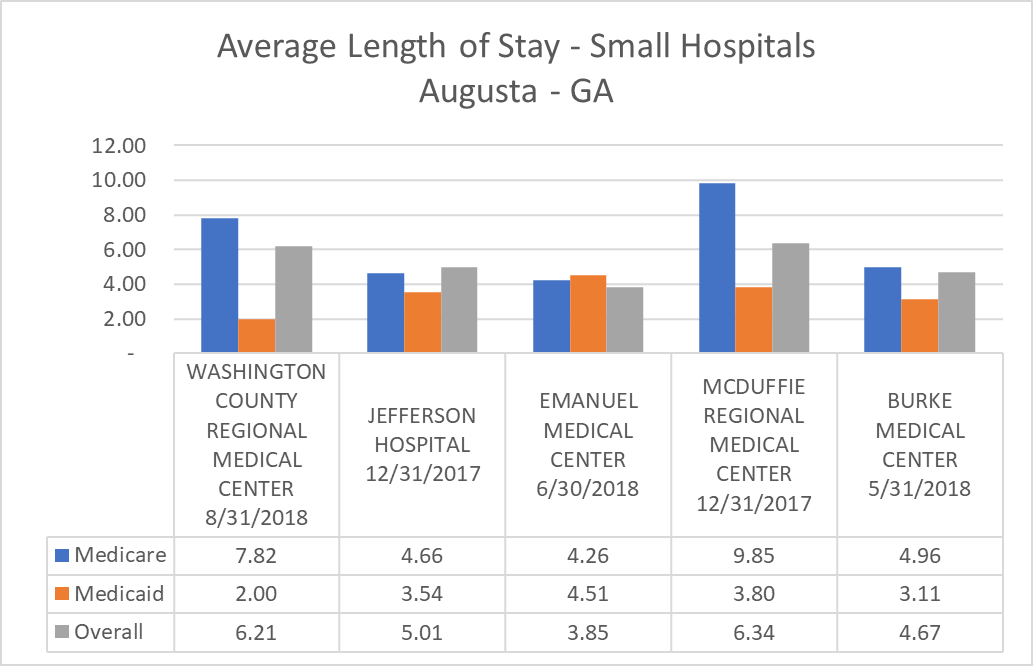
Average Length of Stay
These are short-term acute care hospitals, so the average length of stay (ALOS) should not be very long. Let’s take a look at the data to see what the overall ALOS is, the Medicare ALOS, and the Medicaid ALOS.
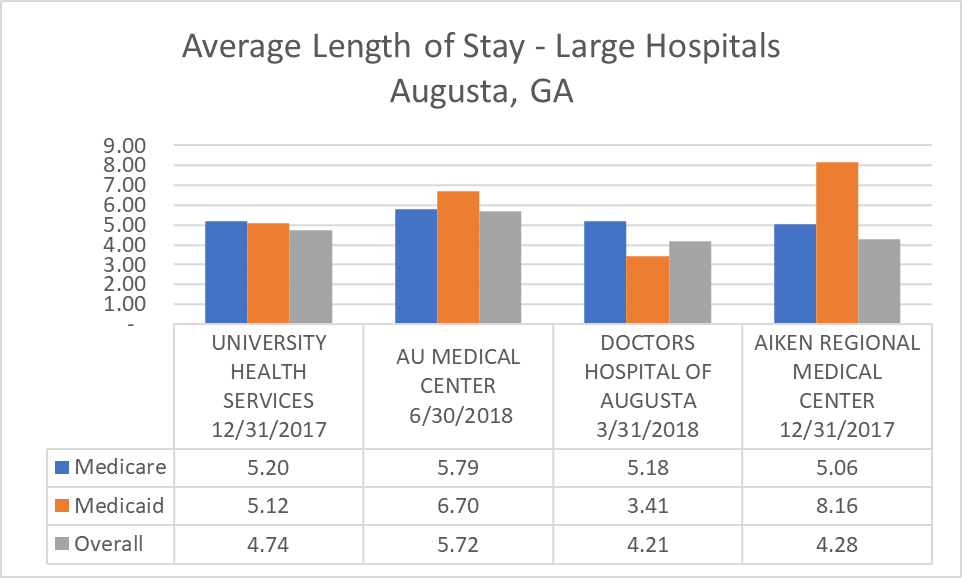
Note: At AU Medical and Aiken Regional, there were no Medicaid HMO discharges reported. This skewed the data such that the ALOS was north of 16 days. For these two figures, I divided Medicaid (did not include Medicaid HMO) days by the number of discharges reported in order to come up with a more reasonable ALOS.
At the larger hospitals, the ALOS is around 5 days. AU Medical has a higher ALOS. They have a Level IV NICU and a Level I trauma unit, so the higher ALOS makes sense.
At the smaller hospitals, they have such low volumes that their ALOS is all over the place. One single patient can really skew their figures. They do have higher Medicare populations and higher length of stays. There is probably a correlation there.
Musing Revelation
I am pleasantly surprised how large the medical community is in Augusta, Georgia. This gives the citizens in this area a plethora of opportunities when medical intervention is needed. These hospitals are providing this community with jobs and tax revenue. Next, I will take a look at just how many jobs and the average salary.
This covers a good portion of Worksheet S-3, Part I on the Medicare Cost Report. All of this data is subject to change at any given time for any number of reasons. My only goal is to look through what is reported to learn more about these hospitals. Hopefully, somewhere along the line you will learn something too.