Savannah, Georgia: Census Data
Today I was out in the garage putting my new sticker on my car tag, so I don’t get pulled over for an expired tag, and a census lady came walking up. She showed me her badge, so I guess she was legit. Her job was to go around verifying addresses. Totally weird to me, but I’m sure she’s just making a living doing what the government tells her to. She did say that she thought the census forms would come out later this year, in case you were wondering.
I like to take a look at the census data to get a better idea of the economic environment in which these hospitals operate. It helps color the picture a little more. In regards to the Medicare cost report, I’m looking to answer these questions:
- How many people live in these areas?
- What the age of the population? This should give insight into how many have Medicare.
- How many are in poverty? This should give us some insignt into how many may qualify for Medicaid or charity.
I’ll cover a few other stats outside of the three questions, but these are my main goal.
Population
Savannah is in Chatham county. For the purposes of this post, I’ll include Effingham and Bryan county stats as well. They are right next door. I’m sure people come from other counties to Savannah, but we’ll just use these three for now.
These are population estimates as of July 1, 2018 per the census website.
| Hospital | County | Beds | Population |
|---|---|---|---|
| Memorial Health, Candler, St Joseph | Chatham | 939 | 289,195 |
| Memorial Health, Candler, St Joseph | Effingham | 939 | 38,109 |
| Memorial Health, Candler, St Joseph | Bryan | 939 | 62,190 |
| Beaufort County, Hilton Head Regional | Beaufort | 260 | 188,715 |
| East Georgia Regional Med Ctr | Bulloch | 142 | 77,296 |
| Wayne Memorial Hospital | Wayne | 88 | 29,808 |
| Meadows Regional Medical Center | Toombs | 52 | 26,887 |
| Evans Memorial Hospital | Evans | 49 | 10,721 |
| Coastal Carolina Hospital | Jasper | 41 | 28,971 |
| Appling Hospital | Appling | 34 | 18,507 |
The way I reported the data, it looks like East Georgia Regional Medical Center has a lot of beds as compared to the population. They probably get patients from surrounding counties. Also, this is where Georgia Southern University is and I’m guessing a good many of the students may not be reported in the census for the area. It’s a guess.
Age of Population
The census reports a couple of age categories: under 5, under 18, and 65 & older. I did a little math to calculate the remainder.
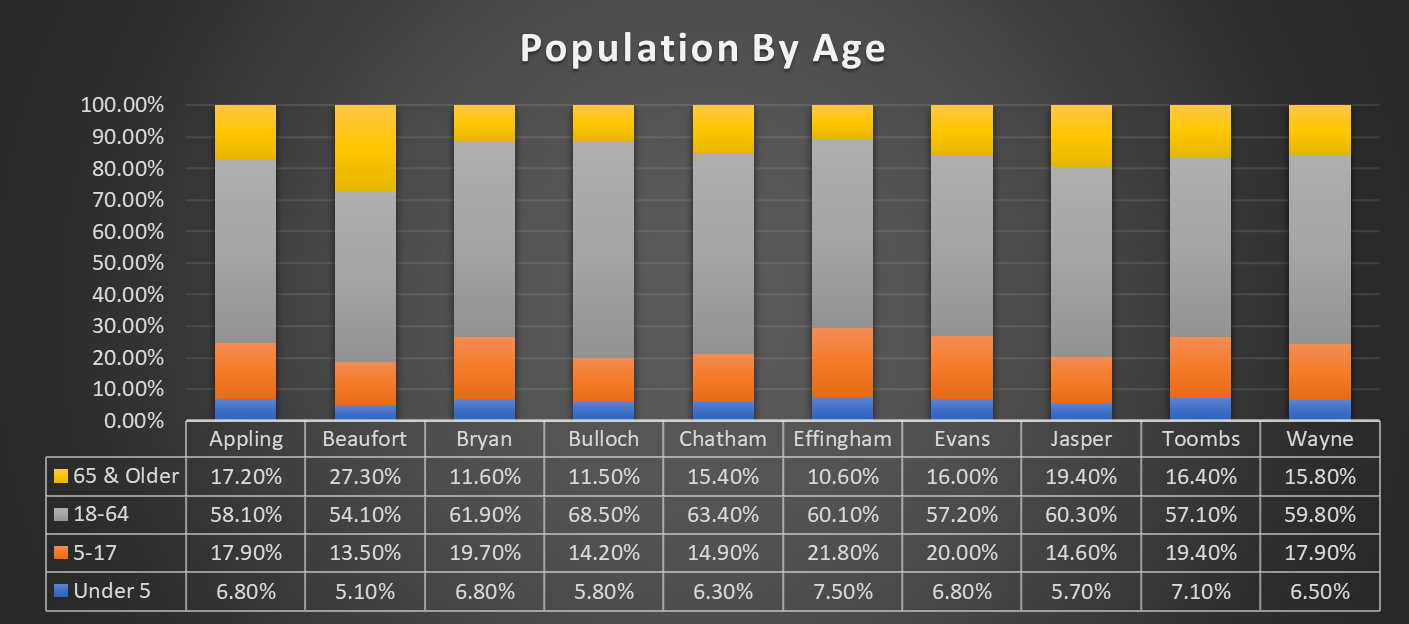
Ah, there it is. Beaufort County is where Hilton Head Regional Medical Center and Beaufort County Memorial Hospital. When I was looking at their Medicare days in an earlier post 1, I noticed they had a larger Medicare population. Now, looking at the census data, we can see they have a much larger population over age 65. It all makes sense now.
Disability Under 65
The statistic will show us what percentage of the population in each county under the age of 65 has a disability.
| County | With a disability, under age 65 years, 2013-2017 |
|---|---|
| Appling | 14.20% |
| Beaufort | 8.50% |
| Bryan | 9.70% |
| Bulloch | 9.50% |
| Chatham | 9.50% |
| Effingham | 8.20% |
| Evans | 11.70% |
| Jasper | 12.50% |
| Toombs | 10.70% |
| Wayne | 13.10% |
This stat always surprises me. I just never thought about the number of people in our community who have a disability. It’s just so much higher than I thought it would be.
With Health Insurance
| County | Persons without health insurance, under age 65 years |
|---|---|
| Appling | 19.10% |
| Beaufort | 15.30% |
| Bryan | 13.60% |
| Bulloch | 16.80% |
| Chatham | 16.20% |
| Effingham | 12.20% |
| Evans | 17.10% |
| Jasper | 20.40% |
| Toombs | 18.60% |
| Wayne | 14.50% |
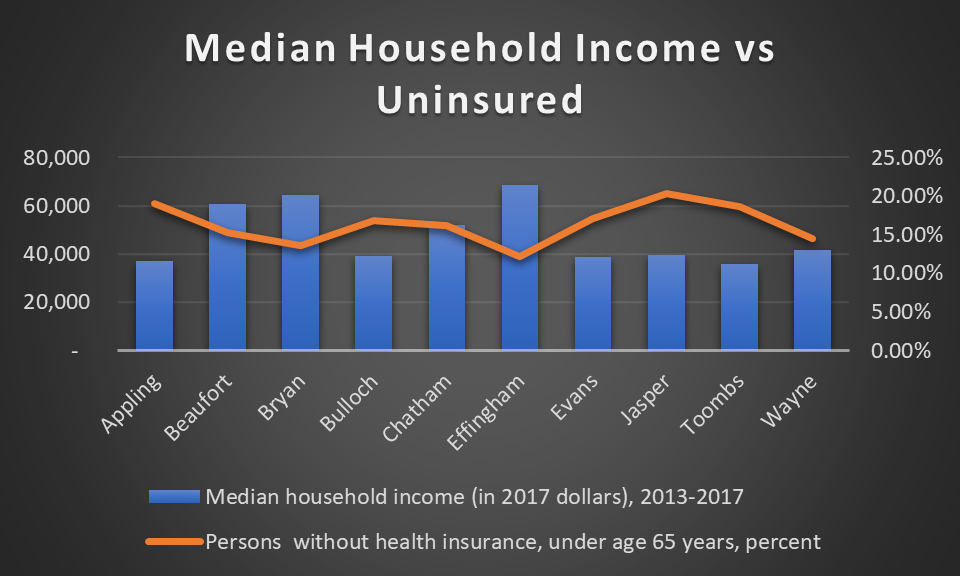
It appears a good many people are still without insurance. The highest values are in Appling and Jasper counties. Let’s see if there is a correlation between lack of insurance and lower household incomes.
Median Household Income
| County | Median household income (in 2017 dollars), 2013-2017 |
|---|---|
| Appling | $37,089 |
| Beaufort | $60,603 |
| Bryan | $64,279 |
| Bulloch | $39,305 |
| Chatham | $52,215 |
| Effingham | $68,589 |
| Evans | $38,736 |
| Jasper | $39,740 |
| Toombs | $35,750 |
| Wayne | $41,534 |
The lowest median household income is in Toombs county. They were not the most with uninsured though. Close, but not the most. Next lowest is Appling and they were the third highest for uninsured. It’s probably logical for there to be a correlation between the two. With lower incomes, you have to prioritize what bills you are going to pay. Health care may not be a priority if you are struggling to keep the lights on.
Here’s a chart showing income vs uninsured. You can see the lower the median income, the greater the uninsured percentage.
Persons in Poverty
| County | Persons in poverty, percent |
|---|---|
| Appling | 22.20% |
| Beaufort | 10.70% |
| Bryan | 9.80% |
| Bulloch | 24.60% |
| Chatham | 16.30% |
| Effingham | 10.40% |
| Evans | 28.00% |
| Jasper | 19.90% |
| Toombs | 22.30% |
| Wayne | 20.20% |
Toombs county has the lowest median income, but does not have the highest percentage of persons in poverty. Effingham has the highest median income, but doesn’t have the lowest percentage of persons in poverty. There’s definitely a correlation between low median income and poverty, but it’s surprising that it doesn’t line up directly.
Housing Values and Rent
| County | Median gross rent, 2013-2017 | Median value of owner-occupied housing units, 2013-2017 |
|---|---|---|
| Appling | $534 | $72,100 |
| Beaufort | $1,105 | $283,800 |
| Bryan | $957 | $155,500 |
| Bulloch | $787 | $131,200 |
| Chatham | $993 | $177,900 |
| Effingham | $1,229 | $201,700 |
| Evans | $630 | $83,600 |
| Jasper | $838 | $130,700 |
| Toombs | $567 | $97,500 |
| Wayne | $609 | $107,300 |
Effingham has the highest rent, but Beaufort has much higher median house values. Effingham does have the highest median income which appears to drive up rent. Beaufort county has a lot of beach front property, so that will drive up the house values a good bit.
Appling has the lowest rent and housing values, which correlates to them have one of the lower median incomes.
Education
| County | High school graduate or higher, percent of persons age 25 years+, 2013-2017 | Bachelor’s degree or higher, percent of persons age 25 years+, 2013-2017 |
|---|---|---|
| Appling | 75.10% | 11.50% |
| Beaufort | 92.70% | 39.80% |
| Bryan | 87.00% | 19.20% |
| Bulloch | 86.70% | 27.90% |
| Chatham | 89.30% | 33.20% |
| Effingham | 91.50% | 32.40% |
| Evans | 76.30% | 15.50% |
| Jasper | 78.80% | 14.80% |
| Toombs | 80.60% | 15.90% |
| Wayne | 81.30% | 12.70% |
Counties with the highest high school graduation rate have the highest median incomes. They also have the highest percentages of bachelor’s degrees. There’s definitely a correlation between education and incomes. Lack of education puts a person at higher risk of poverty. Stay in school. Get the education. It’ll pay off in the long run.
Musing Revalations
These communities are not large, densely populated areas, but several of these counties have a decent size population. The most surprising thing I learned was how large Beaufort county’s over 65 population was. I guess they have a lot of retirees who wanted a beach home. This area is beautiful, so I don’t blame them for wanting to live out their golden years here.
Every time I look at salaries, education and poverty levels, I am always saddened. It’s great to see so many doing well, but there’s a lot of people that are barely scraping by. Having medical care available is vitally important to these people. It gives them a chance to get better to live their best life. These facilities also give people a place to work and are integral part of these communities. Team work.
I obtained this census data from here: https://www.census.gov/quickfacts/fact/table/US/PST045218 on August 15, 2019. I highly recommend checking out this website. It has a lot of interesting information. But it’s not my info and it could be wrong, so don’t blame me. Blame the government.