Augusta, Georgia Area: Diving into the Census Data
This should be a fun data set to look at it. Demographic information is always interesting. There are a few things I am particularly interested in with regards to the Medicare cost report data I’ve been looking at:
- How many people live in these counties?
- What’s the age of the population and does it correlate to the Medicare portion of Inpatient days on the cost report?
- How many are in poverty and does it correlate to the Medicaid portion of the Inpatient days on the cost report?
Those are the three main questions, but I’ll throw in a few more census data points that I find interesting as well.
Population
Per the census, these are population estimates as of July 1, 2018. I’m including number of beds in service at the hospitals located in these counties just as a reference point for me. The large hospitals (AU Medical, Doctors Hospital and University Hospital) are in Richmond County. Columbia County is adjacent to Richmond and these residents are most likely to go to Augusta for medical treatment. I combined the bed count for those three hospitals and will show Richmond and Columbia county populations separately.
| Hospital | County | Beds | Population |
|---|---|---|---|
| Aiken Regional Medical Center | Aiken | 200 | 169,401 |
| Washington County Regional Medical Center | Washington | 56 | 20,386 |
| Emanuel Medical Center | Emanuel | 45 | 22,612 |
| Burke Medical Center | Burke | 40 | 22,423 |
| Jefferson Hospital | Jefferson | 37 | 15,430 |
| McDuffie Regional Medical Center | McDuffie | 25 | 21,531 |
| University, AU Medical, Doctors | Richmond | 1305 | 201,554 |
| University, AU Medical, Doctors | Columbia | 1305 | 154,291 |
It’s pretty obvious that the vast majority of the population in this area is in Richmond, Columbia, and Aiken counties. The bed count correlates to this, which is what one would expect. It is interesting how large of a population difference there is from one county to the next.
Age of Population
The census breaks down the population by those under 5, under 18, and 65 & older. I did a little math to calculate all of the age categories. Let’s see how it looks.
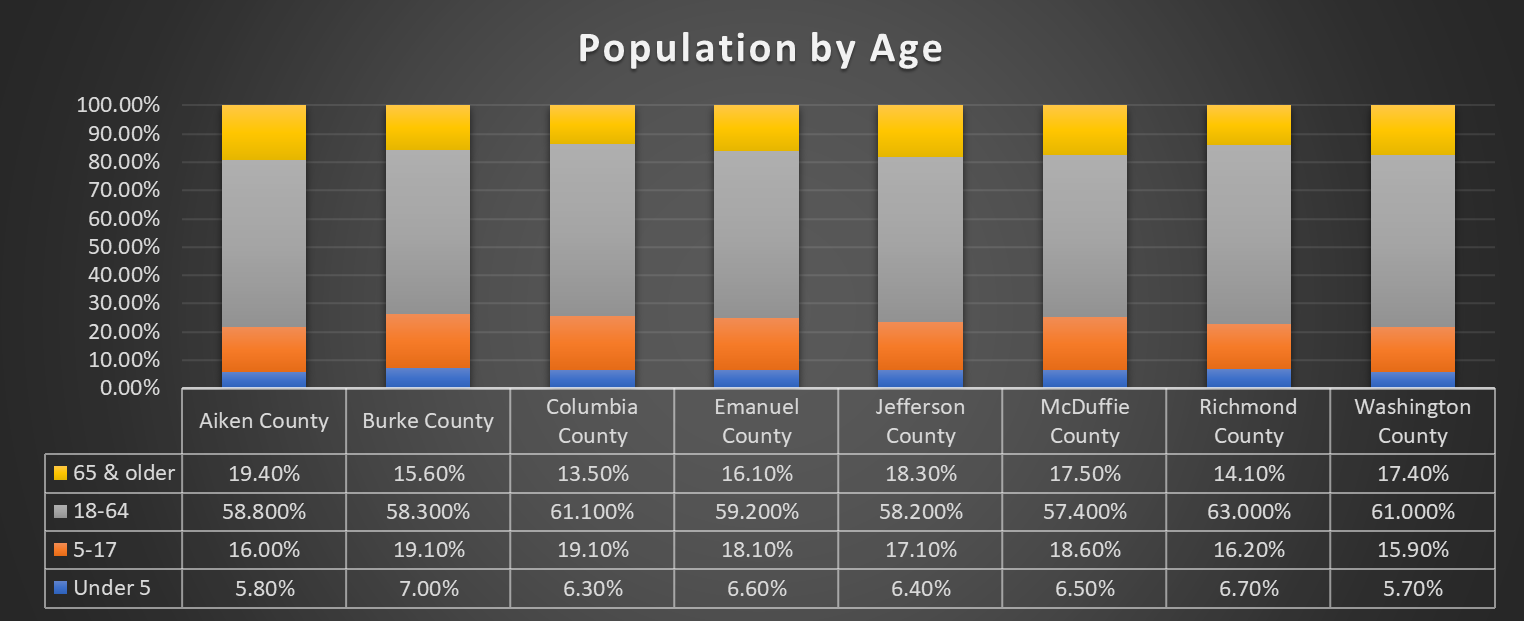
Richmond and Columbia counties have the lowest percentage of those over 65. Aiken county, though, is the highest. Wonder if retirees prefer Aiken county because it’s just over the border in South Carolina. That’s interesting.
Overall, the age of the population is pretty consistent between the counties.
With the population age being consistent, there doesn’t seem to be any correlation between rural hospitals and higher Medicare populations. Maybe older people get sick more often or older people pick the closest hospital for care.
Disability Under 65
This is on the census website, but it appears to come from a different source.
This Fact is based on data collected in the American Community Survey (ACS) and the Puerto Rico Community Survey (PRCS) conducted annually by the U.S. Census Bureau. A sample of over 3.5 million housing unit addresses is interviewed each year over a 12 month period. This Fact (estimate) is based on five years of ACS and PRCS sample data and describes the average value of person, household and housing unit characteristics over this period of collection.1
The definition behind this sample is as follows:
In an attempt to capture a variety of characteristics that encompass the definition of disability, the ACS identifies serious difficulty with four basic areas of functioning – hearing, vision, cognition, and ambulation. These functional limitations are supplemented by questions about difficulties with selected activities from the Katz Activities of Daily Living (ADL) and Lawton Instrumental Activities of Daily Living (IADL) scales, namely difficulty bathing and dressing, and difficulty performing errands such as shopping. Overall, the ACS attempts to capture six aspects of disability: (hearing, vision, cognitive, ambulatory, self-care, and independent living); which can be used together to create an overall disability measure, or independently to identify populations with specific disability types.1
| County | With a disability, under age 65 years, 2013-2017 |
|---|---|
| Aiken | 9.4% |
| Burke | 11.0% |
| Columbia | 8.1% |
| Emanuel | 13.5% |
| Jefferson | 10.0% |
| McDuffie | 7.8% |
| Richmond | 12.8% |
| Washington | 12.6% |
The thing about this statistic that is interesting is there’s around 10% of the population that one of these disabilities. I had no idea it would be that high.
Without Health Insurance
| County | Persons without health insurance, under age 65 years |
|---|---|
| Aiken | 13.4% |
| Burke | 15.2% |
| Columbia | 11.3% |
| Emanuel | 16.0% |
| Jefferson | 16.3% |
| McDuffie | 15.1% |
| Richmond | 14.2% |
| Washington | 15.2% |
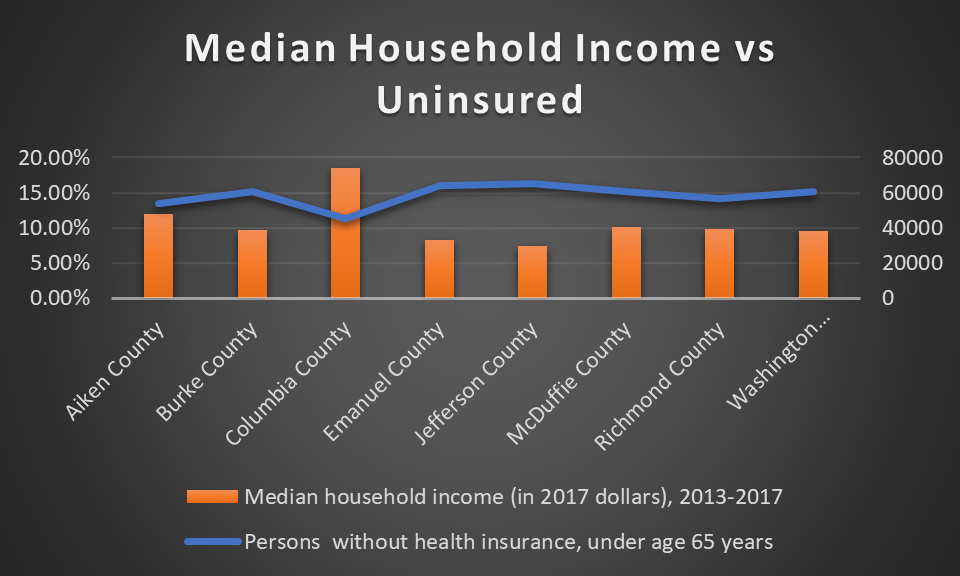
I wonder if there is a correlation between these numbers and median household income. Let’s take a look at that stat next.
Median Household Income
| County | Median household income (in 2017 dollars), 2013-2017 |
|---|---|
| Aiken | $47,713 |
| Burke | $38,707 |
| Columbia | $74,162 |
| Emanuel | $33,089 |
| Jefferson | $29,640 |
| McDuffie | $40,469 |
| Richmond | $39,340 |
| Washington | $38,097 |
For reference, the Federal Poverty Level for a four person household in 2019 is $25,750. It looks like there are a lot of households that are struggling.
It does indeed look like you can’t get blood out of a turnip. I mean, it looks like there’s a correlation between low incomes and being uninsured.
Persons in Poverty
| County | Persons in poverty |
|---|---|
| Aiken | 14.8% |
| Burke | 23.1% |
| Columbia | 6.6% |
| Emanuel | 27.6% |
| Jefferson | 24.0% |
| McDuffie | 21.2% |
| Richmond | 23.7% |
| Washington | 26.7% |
These stats break my heart. Twenty-plus percent of residents in some of these counties are in poverty.
Housing Values and Rent
| County | Median gross rent, 2013-2017 | Median value of owner-occupied housing units, 2013-2017 |
|---|---|---|
| Aiken | $767 | $135,900 |
| Burke | $581 | $86,500 |
| Columbia | $1,117 | $183,800 |
| Emanuel | $569 | $78,500 |
| Jefferson | $536 | $69,200 |
| McDuffie | $625 | $102,500 |
| Richmond | $813 | $100,200 |
| Washington | $656 | $82,400 |
Median housing prices are 250% higher in Columbia county than Jefferson county. Columbia county has the lowest poverty rates, which is probably due to housing affordability. Wonder how education compares between these two counties. It would seem that Columbia county residents would be more educated, which means they demand a higher salary. Higher salaries would mean more money to spend on housing.
Education
| County | High school graduate or higher, percent of persons age 25 years+, 2013-2017 | Bachelor’s degree or higher, percent of persons age 25 years+, 2013-2017 |
|---|---|---|
| Aiken | 86.2% | 25.8% |
| Burke | 80.0% | 11.7% |
| Columbia | 92.3% | 34.4% |
| Emanuel | 79.9% | 12.5% |
| Jefferson | 74.5% | 10.6% |
| McDuffie | 81.2% | 15.3% |
| Richmond | 83.0% | 21.0% |
| Washington | 78.7% | 13.1% |
Columbia county has the highest percentage of High school graduates and the highest median household income. Jefferson county has the lowest. Make sure you get at least a high school education. It makes paying the bills easier. Probably helps with stress levels too.
Population per square mile & Land area
I’m throwing this one in here as a shout out to my hometown. I was raised in Burke County. It’s the second largest county in Georgia. It’s mostly farm land. Where I live now (not in Burke County), there’s 7 high schools. There’s only 1 public high school in Burke County and when I went there, the student population was around 1,200. Small town country living.
Keep in mind Aiken is in South Carolina.
| County | Population per square mile, 2010 | Land area in square miles, 2010 |
|---|---|---|
| Aiken | 150 | 1,071 |
| Burke | 28 | 827 |
| Columbia | 428 | 290 |
| Emanuel | 33 | 681 |
| Jefferson | 32 | 526 |
| McDuffie | 85 | 257 |
| Richmond | 618 | 324 |
| Washington | 31 | 678 |
Musing Revelations
This has been a trip down memory lane for me. Remembering where I grew up. Not a rich community, but I did receive an excellent education and for that, I am very thankful.
Looking at this data is a good reminder of how blessed I am. There are a lot of people in this community that are struggling. If you are one of these people, do something every day to get you closer to the place you want to be. Baby steps.
I obtained this census data from here: https://www.census.gov/quickfacts/fact/table/US/PST045218 on July 26, 2019. I highly recommend checking out this website. It has a lot of interesting information. But it’s not my info and it could be wrong, so don’t blame me. Blame the government. Ha.